 And a lot of comments ensued.....
But drawing a single fit doesn't, IMHO, tell the whole story. There are several sub-trends apparent. I recreated the graph using data that Devin Johnston provided, thank goodness, in this post. I have colour coded the results by party, plotted the election year and leader of the winning party and added linear fits to the sub-trends. What appears to happen is that majorities, usually Liberal, governments with fairly strong initial support diminish to Liberal minority governments being replaced by Conservative minority governments as time goes on. These are then replaced by another trend with a strong mandate for a new, often Conservative, government. The fourth trend may have been subdued by the advent of the Reform, Bloc and Green parties. Absent these entities, the size of Chretien's mandates might have been larger.
 So it follows that Harper can expect to form a majority, not so? The rub is that the Toom Tabard received his mandates as a beneficiary of low or suppressed turn-out. As is shown by the graph of voter turn-out from the Simon Fraser University Political Science Department website, strong mandates and majorities come through large turn-outs. His "wins" depend on suppressed turn-out. Real victories come through large turn-outs. But if there is a strong turn-out he will lose because Harper, his policies and his party are unpopular with most of the electorate. The bigger the turn-out the more likely a Liberal victory given the current Conservative leader and his policies.
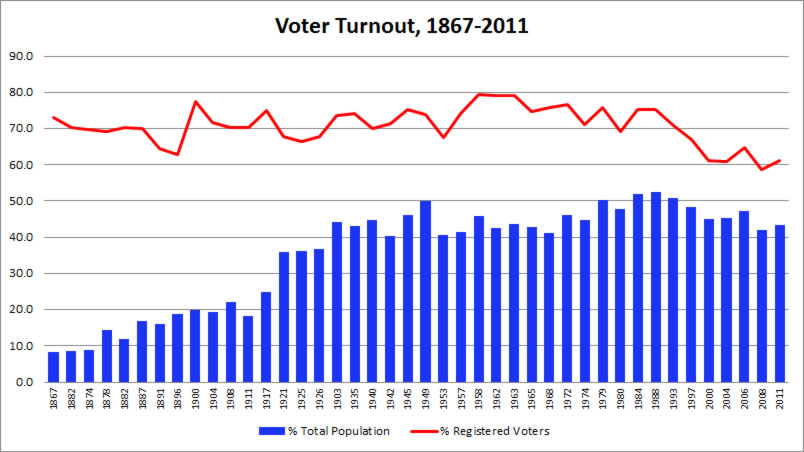 Recommend this Post


No comments:
Post a Comment